

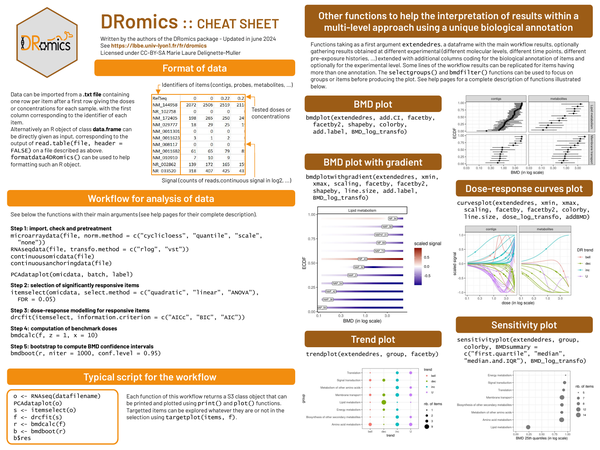
DRomics provides a structured workflow for analyzing dose-response relationships in omics datasets, including microarray, RNA-seq, continuous omics, and anchoring data. The workflow covers data import and preprocessing, selection of significantly responsive items, dose-response model fitting, benchmark dose (BMD) calculation, and bootstrap confidence intervals.
What’s covered#
- Format of data – identifiers, doses, and signal columns
- Step 1 – import, check, and pretreatment (
microarraydata(),RNAseqdata(),PCAdataplot()) - Step 2 – selection of significantly responsive items (
itemselect()) - Step 3 – dose-response modelling (
drcfit()) - Step 4 – computation of benchmark doses (
bmdcalc()) - Step 5 – bootstrap confidence intervals (
bmdboot()) - Typical workflow script
- BMD plot –
bmdplot()andbmdplotwithgradient() - Trend plot –
trendplot() - Sensitivity plot –
sensitivityplot() - Dose-response curves plot –
curvesplot()