

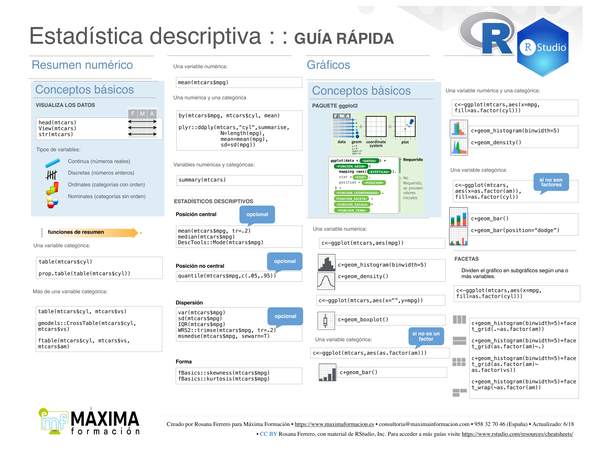
This cheat sheet is in Spanish. It covers descriptive statistics and exploratory visualization
in R, using the mtcars dataset as a running example. Summary functions and ggplot2 plot types
are shown for single variables and combinations of numeric and categorical variables.
What’s covered#
- Basic concepts – visualizing data with
head,View,str; variable types - Numeric summaries for one categorical variable –
table,prop.table,ftable - Numeric summaries for one or more numeric variables –
mean,by,plyr::ddply,summary - Measures of central tendency –
mean,median,DescTools::Mode - Non-central position –
quantile - Dispersion –
var,sd,IQR, trimmed standard error - Shape –
skewness,kurtosis - Plots for one numeric variable –
geom_histogram,geom_density,geom_boxplot - Plots for one categorical variable –
geom_bar - Plots for one numeric and one categorical variable –
geom_histogram,geom_density - Facets –
facet_grid,facet_wrap