

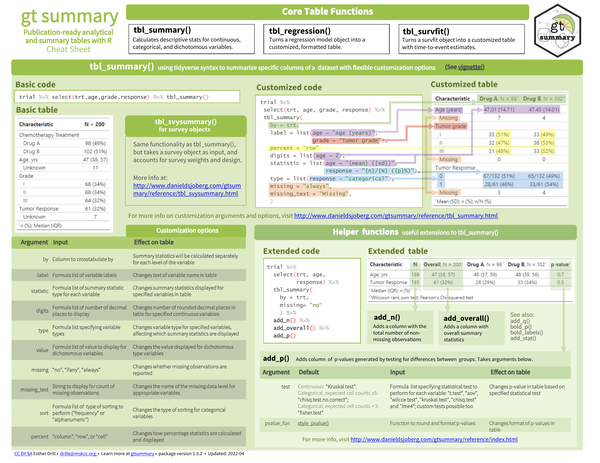
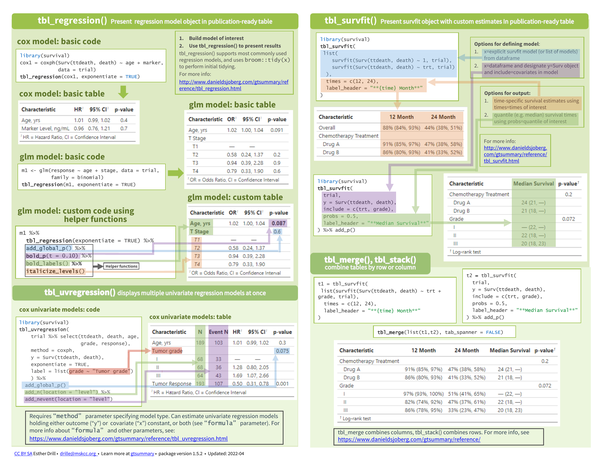
gtsummary turns R data frames and model objects into formatted, customizable tables suitable for publication. A consistent set of add-on functions applies across all table types for adding p-values, overall columns, and formatting.
What’s covered#
tbl_summary()– descriptive statistics for continuous, categorical, and dichotomous variablestbl_svysummary()– survey-weighted descriptive tables- Customization arguments –
by,label,statistic,digits,type,value,missing add_p()– p-value column with configurable statistical testsadd_n(),add_overall(),add_q()– additional columnsbold_p(),bold_labels()– formatting helperstbl_regression()– formatted regression model output with exponentiation optiontbl_survfit()– time-to-event estimates from survfit objects