

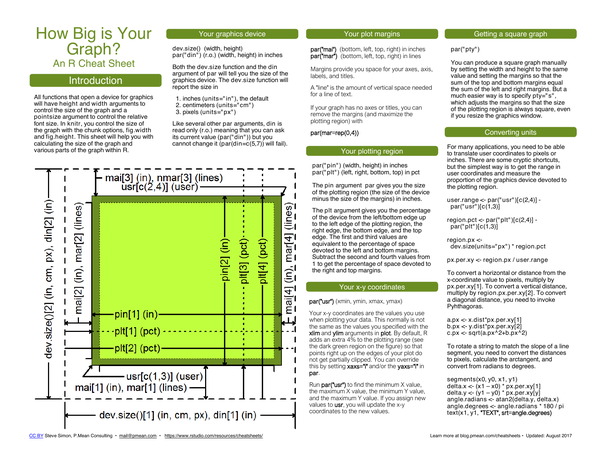
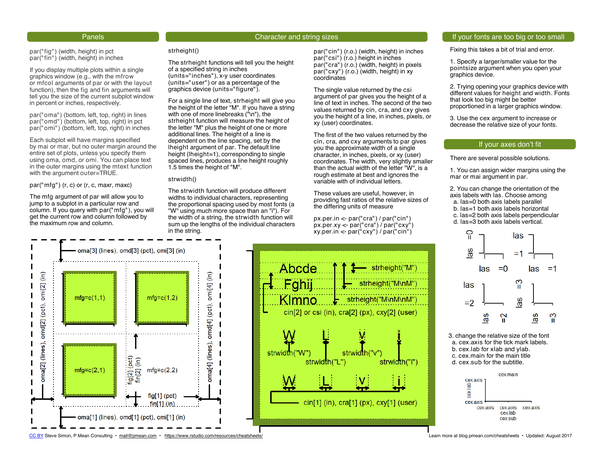
This cheat sheet explains how to measure and manipulate the dimensions of base R graphics. It documents the par() parameters and helper functions that expose device size, margins, plotting region size, and user coordinate ranges, and shows how to convert between units.
What’s covered#
- Your graphics device –
dev.size(),par("din")for width and height in inches, cm, or pixels - Your plot margins –
par("mai")in inches,par("mar")in lines - Your plotting region –
par("pin")size,par("plt")as fraction of device - Your x-y coordinates –
par("usr")for user coordinate range - Getting a square graph –
par(pty="s") - Converting units – translating user coordinates to pixels or inches