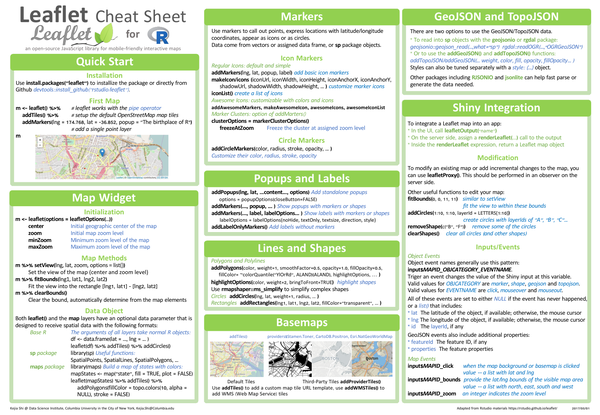
The leaflet package provides an R interface to the Leaflet JavaScript library for creating interactive maps. It supports map widgets, multiple basemap providers, markers, polygons, circles, GeoJSON and TopoJSON layers, and can be embedded in Shiny applications with leafletOutput() and renderLeaflet().
What’s covered#
- Quick start – installation and first map with
leaflet()andaddTiles() - Map widget –
leafletOptions(),setView(),fitBounds(), and data object formats - Markers –
addMarkers(),makeIcon(),addAwesomeMarkers(), cluster options,addCircleMarkers() - Popups and labels –
addPopups(),addMarkers(popup=...),addLabelOnlyMarkers() - Lines and shapes –
addPolygons(),addCircles(),addRectangles() - Basemaps –
addTiles(),addProviderTiles(),addWMSTiles() - GeoJSON and TopoJSON –
addGeoJSON(),addTopoJSON()with style options - Shiny integration –
leafletOutput(),renderLeaflet(),leafletProxy(),fitBounds(),removeShape() - Object events – input event names for markers, shapes, GeoJSON, and map clicks