

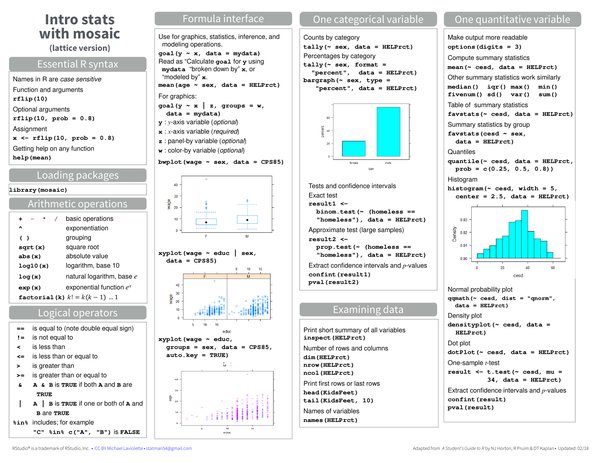
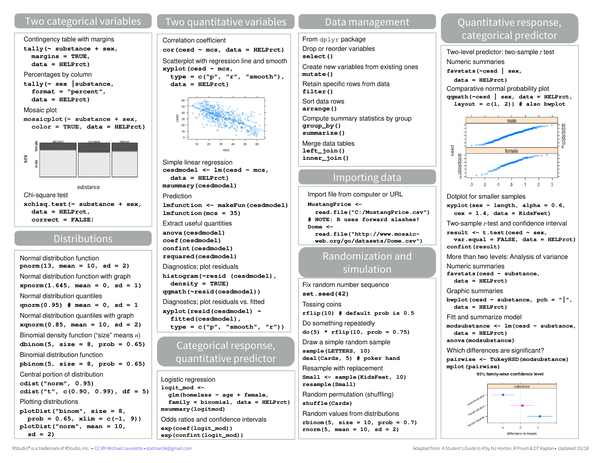
The mosaic package simplifies introductory statistics in R using a unified formula interface (goal(y ~ x, data = ...)) that works consistently across graphics, summary statistics, and hypothesis tests. It wraps common statistical operations such as favstats(), t.test(), and binom.test() and supports dplyr-style data management.
What’s covered#
- Essential R syntax – arithmetic operators, assignment, logical operators
- Formula interface –
goal(y ~ x | z, groups = w, data = ...)pattern for all operations - One categorical variable –
tally(),bargraph(),binom.test(),prop.test() - One quantitative variable –
favstats(),histogram(),densityplot(),t.test() - Two categorical variables – contingency tables,
mosaicplot(),xchisq.test() - Two quantitative variables –
cor(),xyplot(),lm(),msummary() - Data management – dplyr
select(),mutate(),filter(),group_by(),summarize(), joins - Importing data –
read.file()for local paths and URLs - Examining data –
inspect(),dim(),head(),names()