

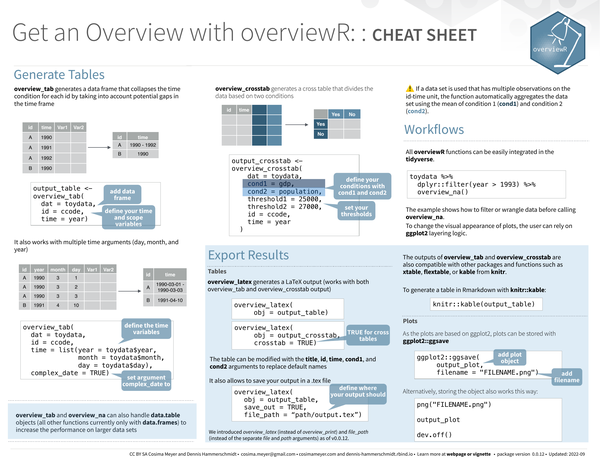
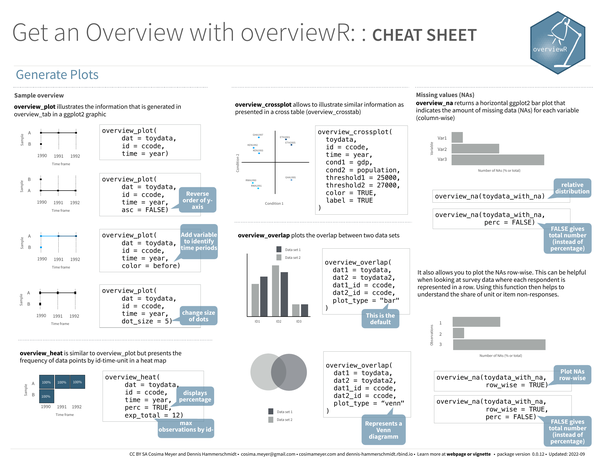
The overviewR package helps researchers inspect the temporal and cross-sectional coverage of panel datasets. It produces summary tables (overview_tab()), cross-tabulations (overview_crosstab()), ggplot2-based sample and NA plots, and LaTeX-ready output compatible with knitr and flextable.
What’s covered#
overview_tab()– collapse time conditions by unit ID, including complex date columnsoverview_crosstab()– cross-tabulate units by two threshold-based conditionsoverview_na()– horizontal ggplot2 bar chart of missing values per variableoverview_plot()– ggplot2 graphic of sample coverage over timeoverview_crossplot()– visualize cross-tabulation conditions as a scatter plot- Export tables –
overview_latex()for LaTeX output withsave_outandfile_pathoptions - Workflows – tidyverse pipe integration and compatibility with knitr
kable()and ggplot2ggsave()