

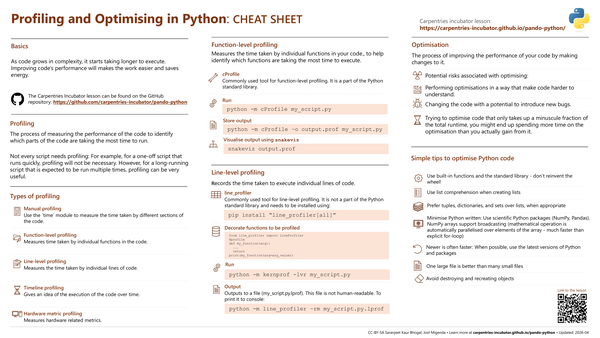
This cheat sheet covers profiling and optimisation of Python code. It explains when profiling is worthwhile, describes function-level profiling with cProfile and line-level profiling with line_profiler, and provides practical tips for speeding up Python code including using NumPy, built-in functions, and appropriate data structures.
What’s covered#
- Basics – what profiling is and when it is (and is not) needed
- Types of profiling – manual, function-level, line-level, timeline, and hardware-metric profiling
- Function-level profiling –
cProfilewithpython -m cProfileandsnakevizvisualization - Line-level profiling –
line_profilerwith@profiledecorator andkernprof - Optimisation risks – readability tradeoffs, new bugs, diminishing returns
- Optimisation tips – built-in functions, list comprehensions, NumPy broadcasting, latest Python version, avoid object churn