

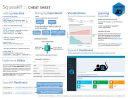
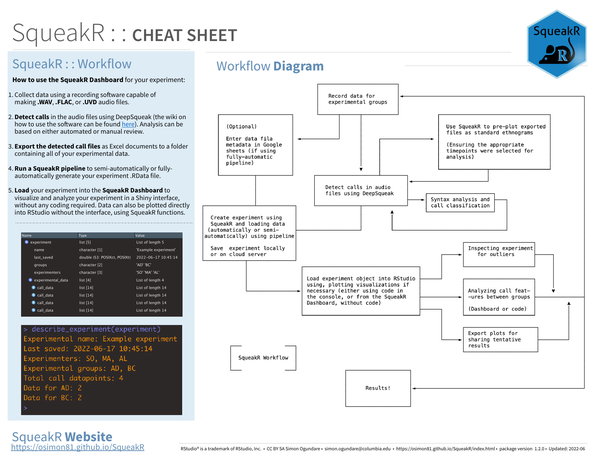
SqueakR is an R package for managing and visualizing ultrasonic vocalization (USV) data produced by the DeepSqueak detection software. It organizes scored call data into experiment objects and provides a code-free Shiny dashboard as well as direct plotting functions in RStudio.
What’s covered#
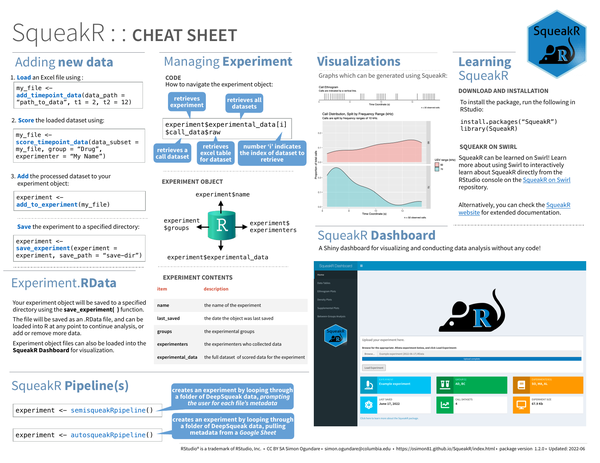
- Adding new data –
add_timepoint_data,score_timepoint_data,add_to_experiment - Managing experiment objects – structure and navigation of the experiment object
- SqueakR pipelines –
semisqueakRpipeline(semi-automatic) andautosqueakRpipeline(Google Sheets) - Visualizations – graphs generated from scored call data
- SqueakR Dashboard – Shiny interface for visualization and analysis without code
- Learning – Swirl-based interactive tutorial