

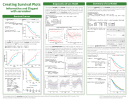
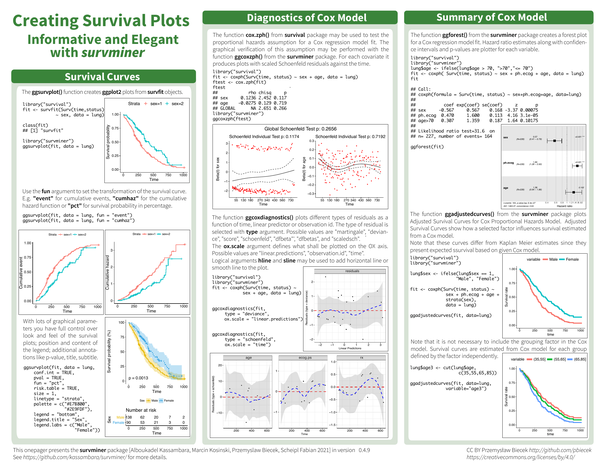
The survminer package provides functions for visualizing survival analysis results, producing ggplot2 graphics from survfit and coxph objects. It covers Kaplan-Meier curves, Cox model diagnostics, forest plots, and adjusted survival curves.
What’s covered#
- Creating survival plots –
ggsurvplotfor survival probability, cumulative event, and cumulative hazard - Survival curves – customizing strata, risk tables, and number at risk
- Diagnostics of Cox model –
ggcoxzphfor testing the proportional hazards assumption - Summary of Cox model –
ggforestfor hazard ratio forest plots - Adjusted survival curves –
ggadjustedcurvesfor Cox model-based group comparisons