

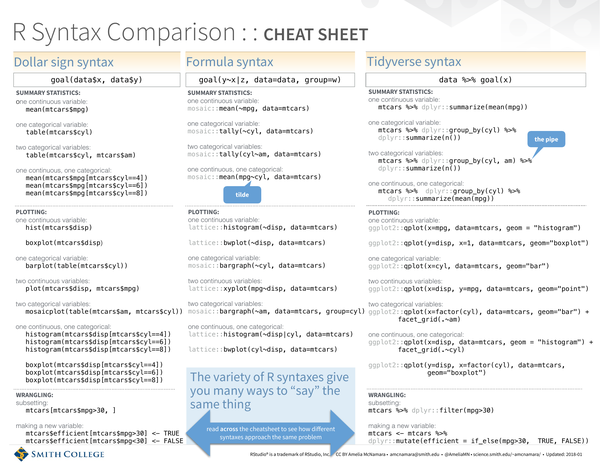
R allows package developers to define their own syntax, resulting in three widely used styles
that express the same operations differently. This cheat sheet shows how base R (dollar sign),
formula (tilde), and tidyverse (pipe) syntax approach summary statistics, plotting, and data
wrangling using the mtcars dataset.
What’s covered#
- Dollar sign syntax –
dataset$variablenotation and square bracket subsetting - Formula syntax – tilde-based syntax used by
lm, lattice, and mosaic - Tidyverse syntax – pipe-based syntax using dplyr and ggplot2
- Summary statistics – one and two variable summaries, categorical and continuous
- Plotting – histogram, boxplot, scatter plot, bar chart, mosaic plot
- Data wrangling – subsetting rows and creating new variables
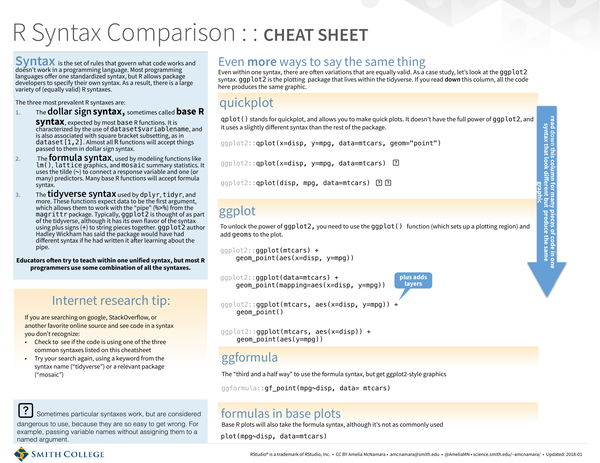
- Variations within ggplot2 –
qplot,ggplot, and ggformula

