

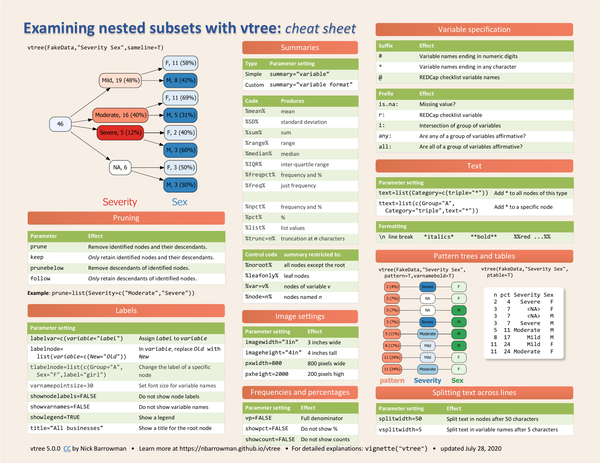
vtree creates graphical displays of nested subsets of a data frame, organizing observations into a tree by combinations of variable categories. It supports custom numerical summaries, pruning of branches, pattern tables, and flexible text and image formatting.
What’s covered#
- Basic usage – calling
vtreewith one or more variable names - Summaries –
%mean%,%SD%,%sum%,%median%,%freqpct%,%npct%,%list% - Pruning –
prune,keep,prunebelow,follow - Variable specification – suffixes (
#,*,@) and prefixes (is.na:,i:,any:,all:) - Labels –
labelvar,labelnode,showvarnames,showlegend,title - Pattern trees and tables –
pattern=T,ptable=T - Image settings –
imagewidth,imageheight,pxwidth - Frequencies and percentages –
vp,showpct,showcount - Text formatting –
splitwidth, bold, italic, color markup